People counting in retail: are you deciding on the right number?
Traditional systems overcount footfall by 30–70%. TrueVisit measures your real visitors, cross-references them with sales, and pinpoints the ones you can act on, based on behavior.
No data required to see the result.
Counting entries isn't measuring customers
A people counter counts crossings at the door: staff coming and going, couriers, the same person re-entering, anyone who glances in and leaves. The number inflates — and on that number you decide staffing, store judgments, and campaign returns.
Real case study · International sporting goods chain · mall store
| Band | Threshold | What it means | Visitors | % |
|---|---|---|---|---|
| Passers-by | < 1 min | Couriers, deliveries, anyone who enters and doesn't stop | 269 | excluded |
| Missed opportunities Actionable | 1–3 min | Customer who entered but wasn't engaged | 1,047 | 29.8% |
| Visits | 3–8 min | Genuine visit, customer weighing a purchase | 1,823 | 51.8% |
| Long visits | > 8 min | Visit threshold reached | 648 | 18.4% |
| Unique visitors | 3,518 | 100% |
Thresholds are configurable store by store.
Which number are you basing your decisions on?
Four ways to visit a store.
Only one you can change tomorrow.
TrueVisit doesn't just count distinct people: it measures how long each one stays and places them in a band. Thresholds aren't universal: you set them store by store, because a flagship and a corner don't share the same rhythm.
The one band a manager can act on tomorrow morning: floor coverage, staffing during peak hours. Exactly what it is, though, depends on how much you want to see.
A time band (1–3 min): customers who came in, stayed briefly, and most likely went unattended. An estimate of who you're missing.
The customer who wasn't served. Flow recognizes who was actually served and for how long: no longer a time-based estimate, but the person no one took care of.
↘ advanced analyticsThe other bands describe how it went. Missed opportunities tell you what to do.
Two conversion rates, not one
Because a family of 4 that buys has converted at 100%, not 25%.
You already measure conversion rate. The question is on which footfall: TrueVisit calculates it on real visitors — not the inflated count — and on a second base that was missing until now, the group. It imports the number of receipts from your systems (through an API) and ties it to footfall, automatically returning two measures of store performance.
How many of the people who entered bought. It measures the store's overall performance.
How many of the decision units bought. The honest measure where people enter together and buy once.
Anywhere people come in as a couple or a group but there's a single receipt, the per-person conversion systematically understates. Only a system that recognizes groups can give the honest one: a traditional people counter doesn't know who came in together.
How you see the data in the TrueVisit Analytics portal — Engagement Funnel: from passer-by to receipt and the two conversion rates.
You don't have to read the charts. We read them for you.
A retail manager doesn't have time to cross-reference time windows, like-for-like days and area benchmarks. So, alongside the funnel above, TrueVisit writes in plain language what's really happening in the store, and what's worth checking.
This is a directly operated store in the APAC region, compared with the same period a year ago. 23,254 people passed in front of the window and 3,518 came in (entry rate 15.1%, better than last year's 14.3% but still below the average for directly operated stores, around 16.8%). Incoming groups number 2,315 (+14% year over year). In short, footfall is growing and bringing more people into the store (+16.5% unique visitors YoY).
What weighs most, though, is what happens right after the threshold. Nearly three visitors in ten — 1,047 people — enter and leave within a few minutes (1–3 min): these are the missed opportunities, customers drawn in but not engaged. This share (29.8%) has worsened from a year ago (it was ~26.5%) and is higher than both the Directly Operated channel average (~24%) and the APAC region (~25%): it's the clearest signal of where to act. Most still make a genuine visit — 1,823 stay 3–8 minutes — while long visits (over 8 min) number 648, down YoY.
On sales the numbers are healthy: 394 receipts, clearly up year over year (+22%) and above the average for stores in the region. The conversion rate is 11.2% per visitor and 17.0% per group, essentially flat but still below the Directly Operated channel average (~12.4% per visitor). In practice: the extra receipts come from higher footfall, not from a better ability to convert.
For anyone working the floor the message is direct: footfall isn't the problem, engagement in the first few minutes is. Recovering even part of those 1,047 missed opportunities — with more floor presence and a quicker greeting during peak hours (Saturday is the busiest day) — is worth more sales than simply increasing the number of crossings.
Not an oracle: a reading aid. The disclaimer isn't a limitation: it's the sign that the system knows its own boundaries, and leaves the last word to the people who really know the store.
Comparing a flagship with a corner tells you nothing
In the reading above, the store is measured against its channel and its region, not against the whole network's average. That's the heart of benchmarking: describe the network by dimensions — region, channel, location type — and each store is compared with its own peer group.
A store manager compared with the network average pushes back, and rightly so: their situation isn't that. Compared with the stores like theirs, they have no argument left to reject the comparison, and they start working on it.
The like-for-like comparison — same perimeter, same days actually open — separates real growth from growth that comes only from new openings or extra days.
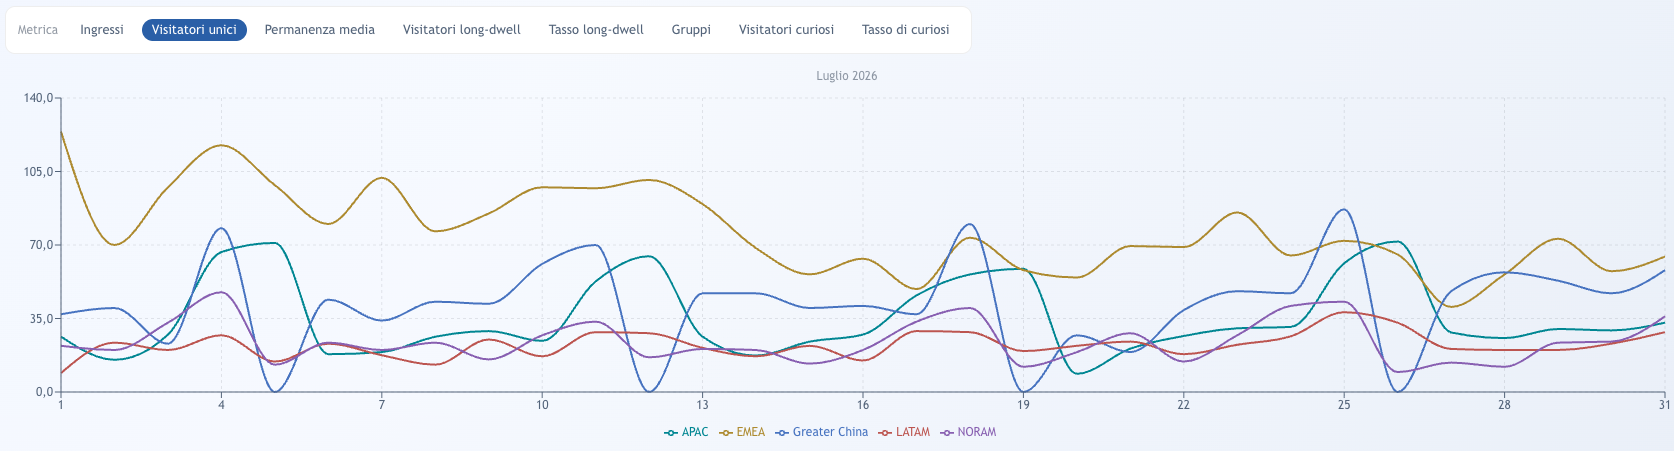
How TrueVisit measures real visitor behavior
Behind every number there are two measures — visitors and service time — and one principle: observe behavior without recognizing who's in front of you.
Measure people without recognizing them
TrueVisit assigns each visitor an anonymous identity, kept for the whole visit. No facial recognition: it analyzes body shape, clothing, accessories and movement patterns, not the person's identity. Video is processed and discarded in real time, with no retention whatsoever.
It's what makes everything you've seen so far possible — real visitors, bands, dual conversion rate — without processing personal data.
Each visitor gets an anonymous ID kept for the whole visit.
Customer service time
When a customer stops in an area or interacts with a staff member, TrueVisit automatically detects the duration of the interaction.
So you can compare engagement across stores and periods, correlate service time with conversion, and size staff presence where it's really needed.
Dwell time and service time are detected automatically.
When you need to understand where and who, not just how many
It's the layer that activates with multi-sensor: beyond footfall and service, TrueVisit analyzes how visitors move through the store and who they really are.
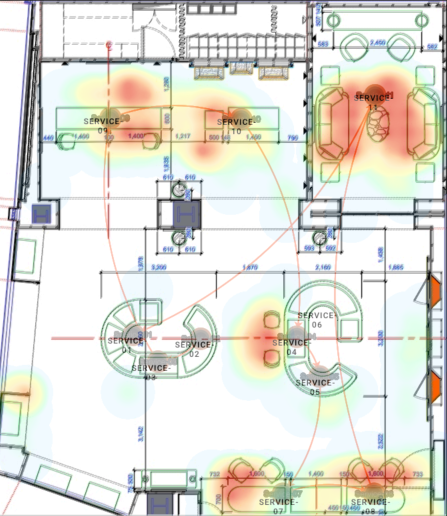
In-store flow analysis
Define the areas you care about and TrueVisit measures, for each, how many visitors pass through, how long they stay and how many staff interactions take place.
From this come the most recurring paths between zones and the heatmaps that show where customers actually linger, not where you think they do.
Visitor demographic profile
TrueVisit breaks visitors down by gender and age band: the store's real audience, not the one assumed by campaigns.
Knowing who really comes in — and how each band behaves — is what lets you tune assortment, messaging and layout to the people you have, not the ones you imagined.
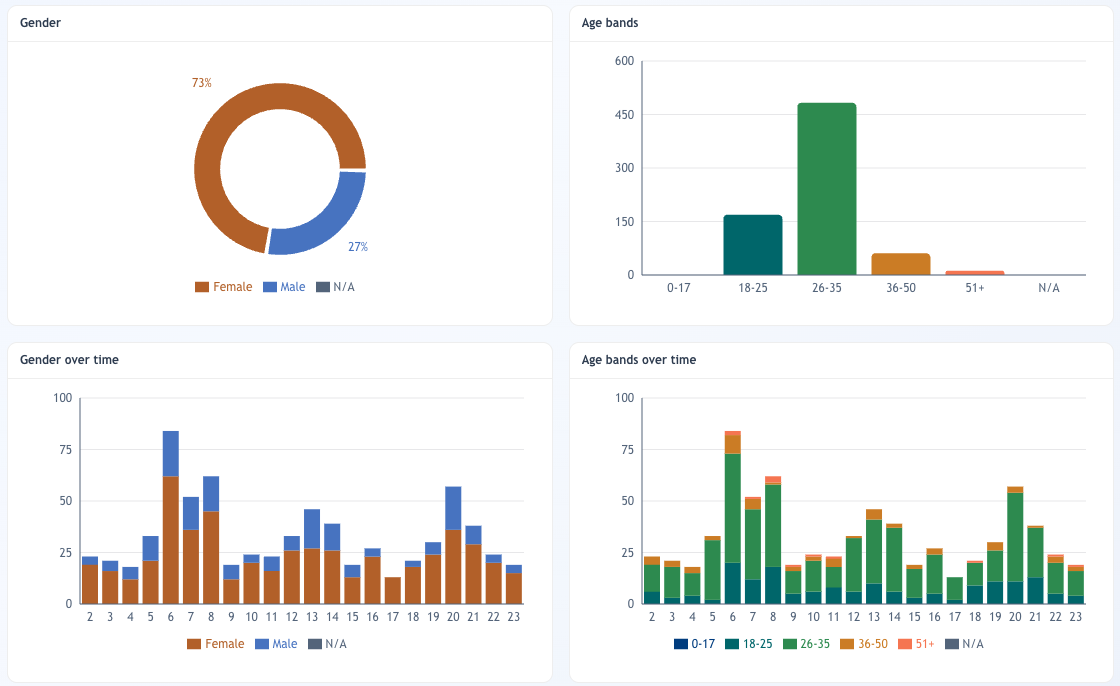
TrueVisit portal: gender, age and historical series.
Who comes in: singles, couples, groups
TrueVisit recognizes whether the person entering is alone, as a couple or in a group, and how this mix changes over time: on weekends, during holidays, by time of day.
It's another piece of the who: a store with heavy family footfall isn't the same as one visited by singles, and it needs to be staffed, laid out and communicated differently. Group conversion rate — the honest measure where people enter together — you already saw in the Conversion section.
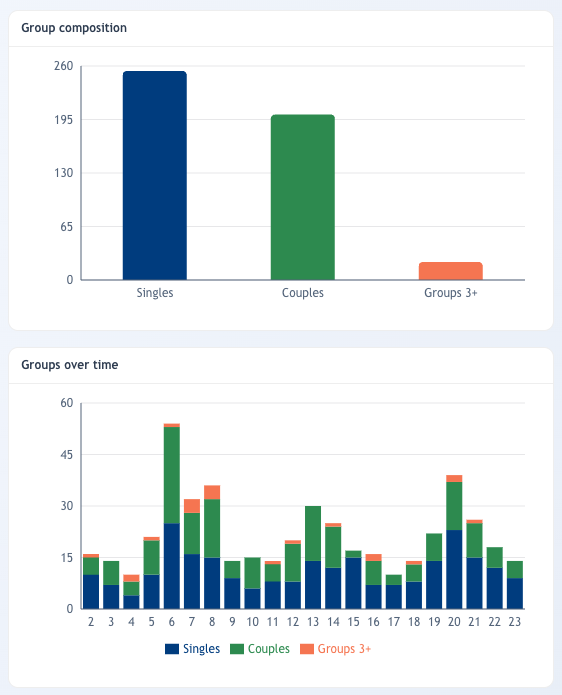
TrueVisit portal: singles, couples and groups.
Traditional people counting vs TrueVisit
| Capability | Traditional People CountingTraditionalOld | TrueVisit Retail Analytics |
|---|---|---|
| Footfall | ||
| Total entry countEntries | ✓ | ✓ |
| Unique visitorsUnique Visitors | ✖ | ✓ |
| Dwell timeDwell Time | ✖ | ✓ |
| Behavior | ||
| Missed opportunities (actionable band)Missed Opportunities | ✖ | ✓ |
| Customer service timeService Time | ✖ | ✓ |
| In-store flow analysisFlow Analysis | ✖ | ✓ |
| Dwell-time heatmapHeatmap | ✖ | ✓ |
| Visitor pathsVisitor Paths | ✖ | ✓ |
| People | ||
| Visitor demographic profile (gender / age)Gender / Age | ✖ | ✓ |
| Visitor group analysisVisitor Groups | ✖ | ✓ |
| Decision | ||
| Conversion rate on unique visitorsReal Conv. Rate | ✖ | ✓ |
| Conversion rate per group (purchase opportunities)Group Conv. Rate | ✖ | ✓ |
| AI analysis (plain-language reading)AI Analysis | ✖ | ✓ |
A platform that grows with your store
Two configurations on the same setup: choose based on how deeply you want to see your store.
TrueVisit One
Single sensorReal visitors and reliable conversion rate
A single sensor at the entrance measures real footfall by filtering out irrelevant crossings and keeping an anonymous identity for the whole visit.
- Real Unique Visitors
- Real conversion rate
- In-store Dwell Time
- Gender detection
- Automatic staff exclusion
- Service-entry exclusion (couriers and deliveries)
TrueVisit Flow
Multi sensorStore flow and area analysis
Extends the One configuration's capabilities to analyze how customers move through the space, where they linger, where staff interactions happen and for how long.
- Area, interaction and dwell-time analysis
- Flow analysis between areas
- Dwell and passage heatmaps
- Most frequent paths in the store
- Customer service time by area
Start with One. Add Flow when you need to understand where visitors move, not just how many there are. Same setup, no replacement.
Optional modules
Available on both configurations.
Age detection
With this module, every analysis can be broken down by age band.
Group detection
Analysis of individual, couple and group visits. Conversion rate calculated on real sales opportunities (groups).
How reliable is your stores' footfall?
Start from how you measure entries and dwell today: in a few minutes we'll see whether the number you decide on really reflects your customers, and where it's worth starting.
To book a meeting we load the HubSpot calendar, which sets cookies. You can enable it here.
Why consent is needed